Playing with Libmalloc in 2024
Filed by Josh Pitts (ausernamedjosh) on January 2, 2024
TL;DR
In this post, I introduce a new tool called heapster that allows you to play with macOS libmalloc. I walk you through how to use this tool and a couple strange things I found along the way.
INTRODUCTION
Where were you when you first learned about heap allocation? I can’t tell you when I heard about dynamic memory allocation but it was probably about the same time I learned how to exit vim and I can’t remember when I learned that.
This is the first of a series of blog posts looking into memory allocators. For this first blog post as I meander down Allocator Alley, I decided to look at libmalloc the default memory allocator for macOS. There are other heap implementations that can be used on macOS such as jemalloc, Hoard, and mimalloc. But this blog post is just libmalloc. As such, I reviewed past research on libmalloc, the current implementation of libmalloc in 2023, and I’ll talk about what’s new. I’m also releasing a tool to help you and I understand it all, called heapster.
As you may already know, there are two default allocators on macOS. Libmalloc for userland heap implementations and the XNU Kernel has its own memory allocator. As I briefly mentioned, application developers can bring their own heap implementations. Generally, heap allocators obtain memory from the operating system through system calls, such as mmap and/or sbrk. Libmalloc uses mach memory APIs such mach_vm_allocate and mach_vm_map . Generally, these memory libraries wrap system calls and work to provide a safer framework for managing memory than rolling your own memory management system.
PRIOR AND MOST RECENT RESEARCH
2005: OS X heap exploitation techniques, by Nemo
This article explained Apple’s then Libc-391 malloc implementation, gave an example exploitation of a heap overflow, a Webkit bug, and examples for an integer overflow and double-free.
2009: Mac OS Xploitation, Dino A. Dai Zovi
This presentation discussed stack and heap exploitation on macOS. It outlined the memory ranged regions of libmalloc from Tiny to Huge. At the time, allocated memory was executable and there was no ASLR so exploitation was “fun”.
2011: Attacking the Webkit heap, by Agustin Gianni & Sean Heelan
A presentation given at Infiltrate discussing tcmalloc and the exploitation of that heap implementation.
2016: In the Zone: OS X Heap Exploitation, by Tyler Bohan
This presentation dives into libmalloc, a magazine allocator, and details about it’s internals. The presentation includes strategies for exploitation. I recommend you read it, it’s mostly still applicable today. Tyler released a script for lldb called MacHeap, that I will update in the future.
2018: Heapple Pie, by Eloi Benoist-Vanderbeken
This presentation presents great graphics breaking down what’s in each rack, the layout the magazine (1 per core), regions within each magazine, quantums within each region, the metadata of each region, and how it all works together.
2019: https://www.slideshare.net/AngelBoy1/macos-memory-allocator-libmalloc-exploitation
A large set of slides which walk through the process of freeing memory in Tiny and Small regions and some attacks on both regions.
I also referenced Johnathan Levin’s *OS books. I do recommend them, they are great.
CURRENT MACOS HEAP IMPLEMENTATION
Before October 6th, 2021 there were four memory zones that are used in libmalloc:
- Nano
- Disabled by default unless the
MallocNanoZoneenvironment variable is set to 1. - Size: 0 < 256 Bytes
- Quantum: 16 bytes
- Disabled by default unless the
- Tiny
- Size: 0 ≤ 1008 Bytes or
- If Nano is enabled: 257 Bytes ↔ 1008 Bytes
- Quantum: 16 bytes
- Small
- Size: 1009 Bytes ↔ 127 KB
- Quantum: 512 bytes
- Large
- Range: 127 KB → ∞?
Each zone has a size range, and a minimum amount that will be allocated, a quantum, up to the next quantum boundary. So if you want 1 byte of memory (for the Nano or Tiny zones), congrats you get 16 bytes for free.
Interestingly, the nano zone was enabled by default sometime in 2018, maybe earlier. By the nano zone being enabled by default, it caused memory leaks as libmalloc did not coalesce freed nano memory blocks at the time. This bug affected numerous applications such as electron and chrome. As of MacOS Sonoma 14.2, nano is still enabled by default.
A new ‘Medium’ allocator was added on October 6, 2021, it fits between Small and Large allocators. You can find these zones in thresholds.h.
- Nano
- Enabled by default unless the
MallocNanoZoneenvironment variable is set to 0. - Range: 0 < 256 Bytes
- Quantum: 16 bytes
- Enabled by default unless the
- Tiny
- If nano is disabled it starts at 0.
- Range: 0 ≤ 1008 Bytes
- Quantum: 16 bytes
- Small
- Range: 1009 Bytes ↔ 32 KB
- Quantum: 512 bytes
- Medium
- Range: 32 KB ↔ 8192 KB
- Quantum: 32 KB
- Large
- Range: 8192 KB → ∞?
PLAYTIME - INTRODUCING HEAPSTER
Like many of you, I’m a hands-on learner. Looking at graphs with arrows trying to describe how the heap works doesn’t work for me. It’s like describing a duck versus seeing a duck with your own eyes.


Ok. Whatever those are they weigh less than the surface tension of water.
Anyway, I wrote a tool to help me understand how libmalloc works.
Heapster (pronounced like hipster if you were a native French speaker) is written in C and you can compile it with clang: clang heapster.c -o heapster. It is not a secure program! To use heapster, set an initial assignment of memory you want allocated at execution: ./heapster [bytes_of_heap_allocated] [number_of_allocation]. For example, let’s allocate 1 byte two times at application start.
./heapster 1 2
Allocated at 0x6000021d4010 Zone: Nano
Allocated at 0x6000021d4020 Zone: Nano
Enter command:
Heapster tells you the address and zone allocated. Now you can issue additional commands.
Enter command: help
Commands:
  free [address]
  malloc [size] [num_allocations]
  uw [size] [address] - uncontrolled write
  execute - executes last freed address
  cw [where_hex_address] [what_hex_value] - controlled write
  spray [size] [address] [number of allocations] - heap spray an address as the payload
  request [request_number] - similar to a leaky service :D
  show_leaks - show if you have any memory leaks
  dump - dump (print) the contents of an address
  exit
Enter command:
I’ll use each of these commands and hopefully you’ll understand everything by the end of this post.
Now you might have noticed that I asked for 1 byte of memory, but malloc gave us 0x10 (16) bytes of memory. Is it wasteful? Not really, we’re not using Commodore 64s anymore. The reason it’s allocating 16 bytes is because that’s the minimum amount allocated for the nano zone, also called the quantum. Let’s test it and malloc 17 bytes 5 times. I’ll also use the malloc cmd.
Enter command: malloc 17 5
Allocated at 0x6000023d8000 Zone: Nano
Allocated at 0x6000023d8020 Zone: Nano
Allocated at 0x6000023d8040 Zone: Nano
Allocated at 0x6000023d8060 Zone: Nano
Allocated at 0x6000023d8080 Zone: Nano
Now you can see that it malloc’d 32 bytes for each allocation, honoring the 16 byte nano quantum size. Each zone has it’s own quantum size.
Next I’ll free an address and then malloc the same size chunk again.
Allocated at 0x6000023d8000 Zone: Nano
Allocated at 0x6000023d8020 Zone: Nano
Allocated at 0x6000023d8040 Zone: Nano
Allocated at 0x6000023d8060 Zone: Nano
Allocated at 0x6000023d8080 Zone: Nano
Enter command: free 0x6000023d8000
Freed 0x6000023d8000
Enter command: malloc 17 1
Allocated at 0x6000023d8000 Zone: Nano
What are the chances of this - a call to malloc reused the last freed address? I don’t have control over how the system chooses the address.
Enter command: free 0x6000023d8000
Freed 0x6000023d8000
Enter command: malloc 17 1
Allocated at 0x6000023d8000 Zone: Nano
Enter command: free 0x6000023d8000
Freed 0x6000023d8000
Enter command: malloc 17 1
Allocated at 0x6000023dd1c0 Zone: Nano
Enter command: malloc 17 1
Allocated at 0x6000023dd1e0 Zone: Nano
Enter command: malloc 17 1
Allocated at 0x6000023d4000 Zone: Nano
Enter command: malloc 17 1
Allocated at 0x6000023dd200 Zone: Nano
It is quite random:
./heapster 17 10
Allocated at 0x600003c04000 Zone: Nano
Allocated at 0x600003c0c2c0 Zone: Nano
Allocated at 0x600003c0c2e0 Zone: Nano
Allocated at 0x600003c0c300 Zone: Nano
Allocated at 0x600003c0c320 Zone: Nano
Allocated at 0x600003c0c340 Zone: Nano
Allocated at 0x600003c0c360 Zone: Nano
Allocated at 0x600003c0c380 Zone: Nano
Allocated at 0x600003c0c3a0 Zone: Nano
Allocated at 0x600003c0c3c0 Zone: Nano
Enter command: free 0x600003c04000
Freed 0x600003c04000 <--- Freed
Enter command: malloc 17 1
Allocated at 0x600003c08f00 Zone: Nano
Enter command: malloc 17 1
Allocated at 0x600003c08f20 Zone: Nano
Enter command: malloc 17 1
Allocated at 0x600003c08f40 Zone: Nano
Enter command: malloc 17 1
Allocated at 0x600003c0c3e0 Zone: Nano
Enter command: malloc 17 1
Allocated at 0x600003c00000 Zone: Nano
Enter command: malloc 17 1
Allocated at 0x600003c0c400 Zone: Nano
Enter command: malloc 17 1
Allocated at 0x600003c08f60 Zone: Nano
Enter command: malloc 17 1
Allocated at 0x600003c04000 Zone: Nano <--- Reused
How can this behavior be abused? How can one use the freed addresses? Why would you want to use an address after it has been freed? What’s in the address when it is used? I can’t you tell why you’d want to, what data is in it, but it is a bug class to its own called Use After Free (UAF). Abusing this vulnerability depends entirely on the Rube Goldberg machine you are exploiting!
In heapster, you have the ability to malloc and write to an address arbitrary data through the uw or “uncontrolled write” command -uw [size] [address], where size is in bytes to malloc and address is a function pointer to write to that malloc’d address. The idea is, you don’t have full control over where the data that you will write will be allocated. But you can increase your chances of overwriting freed addresses if you can find a pattern in the heap implementation. In heapster, you can simulate the execution of freed memory. Theexecute command executes the last freed address. In this designed example, you don’t have control of where the application will assign the malloc’d memory. But I can simulate the execution of the freed memory.
Here’s an example using the uw and execute commands back to back, leaking the flag function address so I can pass it to malloc’d memory:
./heapster 257 10 --show-flag
Address of flag function: 0x10097ecd4 <-- flag address
Allocated at 0x138f04080 Zone: Tiny
Allocated at 0x138f04190 Zone: Tiny
Allocated at 0x138f042a0 Zone: Tiny
Allocated at 0x138f043b0 Zone: Tiny
Allocated at 0x138f044c0 Zone: Tiny
Allocated at 0x138f045d0 Zone: Tiny
Allocated at 0x138f046e0 Zone: Tiny
Allocated at 0x138f047f0 Zone: Tiny
Allocated at 0x138f04900 Zone: Tiny
Allocated at 0x138f04a10 Zone: Tiny
Enter command: free 0x138f04080
Freed 0x138f04080
Enter command: uw 257 0x10097ecd4
Wrote the user-provided address 0x10097ecd4 into allocated block at 0x138e043c0 <-- not the same address
Enter command: execute
Attempting to execute last freed address 0x138f04080
[1]    45123 segmentation fault  ./heapster 257 10 --show-flag
Executing freed memory caused a segmentation fault. Why? For the Tiny zone, freed memory is nulled and I didn’t write anything interesting to it. In this next example, the memory is overwritten with the uw command and executed.
./heapster 257 10 --show-flag
Address of flag function: 0x104fa6cd4
Allocated at 0x120e043c0 Zone: Tiny
Allocated at 0x120e04580 Zone: Tiny
Allocated at 0x120e04690 Zone: Tiny
Allocated at 0x120e047a0 Zone: Tiny
Allocated at 0x120e048b0 Zone: Tiny
Allocated at 0x120e049c0 Zone: Tiny
Allocated at 0x120e04ad0 Zone: Tiny
Allocated at 0x120e04be0 Zone: Tiny
Allocated at 0x120e04cf0 Zone: Tiny
Allocated at 0x120e04e00 Zone: Tiny
Enter command: free 0x120e043c0
Freed 0x120e043c0
Enter command: uw 257 0x104fa6cd4
Wrote the user-provided address 0x104fa6cd4 into allocated block at 0x120e043c0 <--winner
Enter command: execute
Attempting to execute last freed address 0x120e043c0
You found the flag!
I ran these two commands back to back. Imagine an exploitable UAF bug, that results in Local Privilege Escalation, in a userland application where you can restart the application over and over. I can live with these odds for success!
However, most applications are not going to hand you a clean memory pallet. As such, I have incorporated the --randomized parameter. Where the memory allocations and lengths are both random and the first two command line arguments are ignored.
./heapster 4 1 --randomize
Randomized number of allocations: 6
Allocated at 0x145809800 Zone: Small
Allocated at 0x148008000 Zone: Medium
Allocated at 0x14580fc00 Zone: Small
Allocated at 0x148018000 Zone: Medium
Allocated at 0x148028000 Zone: Medium
Allocated at 0x148038000 Zone: Medium
Enter command:
You can’t use --show-flag and --randomize at the same time. However, to simulate a memory leak, I included the request command which is a “service” that will “leak” memory. To retrieve the “leaked” memory, use the command show_leaks.
Enter command: request 1
Handling request 1, session data at 0x600003618000
Enter command: request 5
Handling request 5, session data at 0x60000361c000
Memory leak simulated, data for request 5 not freed!
Enter command: show_leaks
Leaked block at 0x60000361c000
Hmmmm: 0x104e5ecd4
Enter command:
Now that I have the flag function address, let’s try to free some memory and overwrite the freed memory. I’m picking address 0x148028000 to free as I can assume the size of the memory is less than 0x10000 (or 65535 bytes). 0x148038000 - 0x148028000 = 0x10000.
Allocated at 0x148028000 Zone: Medium
Allocated at 0x148038000 Zone: Medium
Enter command: request 1
Handling request 1, session data at 0x600003618000
Enter command: request 5
Handling request 5, session data at 0x60000361c000
Memory leak simulated, data for request 5 not freed!
Enter command: show_leaks
Leaked block at 0x60000361c000
Hmmmm: 0x104e5ecd4
Enter command: free 0x148028000
Freed 0x148028000
Wrote the user-provided address 0x104e5ecd4 into allocated block at 0x128508000
Enter command: uw 65535 0x104e5ecd4
Wrote the user-provided address 0x104e5ecd4 into allocated block at 0x128608000
Enter command: uw 65535 0x104e5ecd4
Wrote the user-provided address 0x104e5ecd4 into allocated block at 0x138208000
Enter command: uw 65535 0x104e5ecd4
Wrote the user-provided address 0x104e5ecd4 into allocated block at 0x138218000
Enter command: uw 65535 0x104e5ecd4
Wrote the user-provided address 0x104e5ecd4 into allocated block at 0x148028000 <-- winner
Enter command: execute
Attempting to execute last freed address 0x148028000
You found the flag!
Now, you might not have the ability to view what memory has been allocated and their addresses. However, If you have the ability to malloc memory and write dozens of times or more, you can perform a heap spray. In this application, you could malloc a couple chunks of memory of the same size, free the last block, then heap spray to potentially overwrite the freed block. I have a spray option to demonstrate the concept.
./heapster 4 1 --randomize
Randomized number of allocations: 74
Allocated at 0x124809800 Zone: Small
Allocated at 0x12480bc00 Zone: Small
Allocated at 0x124813c00 Zone: Small
Allocated at 0x12481b200 Zone: Small
Allocated at 0x128008000 Zone: Medium
Allocated at 0x128018000 Zone: Medium
[snip]
Enter command: malloc 257 10
Allocated at 0x124704080 Zone: Tiny
Allocated at 0x125004080 Zone: Tiny
Allocated at 0x125004190 Zone: Tiny
Allocated at 0x1250042a0 Zone: Tiny
Allocated at 0x1250043b0 Zone: Tiny
Allocated at 0x1250044c0 Zone: Tiny
Allocated at 0x1250045d0 Zone: Tiny
Allocated at 0x1250046e0 Zone: Tiny
Allocated at 0x1250047f0 Zone: Tiny
Allocated at 0x125004900 Zone: Tiny
Enter command: free 0x125004900
Freed 0x125004900
Enter command: request 5
Handling request 5, session data at 0x6000016ac000
Memory leak simulated, data for request 5 not freed!
Enter command: show_leaks
Leaked block at 0x6000016ac000
Hmmmm: 0x104622cd4
Enter command: spray 257 0x104622cd4 1500 <-1500 malloc+writes of the flag address
Sprayed 0x104622cd4 to 0x124704190
Sprayed 0x104622cd4 to 0x1247042a0
Sprayed 0x104622cd4 to 0x1247043b0
Sprayed 0x104622cd4 to 0x1247044c0
[snip] 750 down...
Sprayed 0x104622cd4 to 0x12461cd30
Sprayed 0x104622cd4 to 0x12461ce40
Sprayed 0x104622cd4 to 0x125004900 <--winner
Sprayed 0x104622cd4 to 0x125004a10
Sprayed 0x104622cd4 to 0x125004b20
[snip]
Enter command: execute
Attempting to execute last freed address 0x125004900
You found the flag!
Heap spraying is an old concept.
Another command to show you is controlled write or cw . You can use it with the execute command by allocating memory, then free a block, next write the flag to the freed address and execute the freed address. I included functionality for myself for testing.
./heapster 4 4 --show-flag
Address of flag function: 0x104706cd4
Allocated at 0x600001bf4000 Zone: Nano
Allocated at 0x600001bf4010 Zone: Nano
Allocated at 0x600001bf4020 Zone: Nano
Allocated at 0x600001bf4030 Zone: Nano
Enter command: www
Usage: www [where_hex_address] [what_hex_value]
Enter command: free 0x600001bf4030
Freed 0x600001bf4030
Enter command: www 0x600001bf4030 0x104706cd4
Written 0x104706cd4 to 0x600001bf4030
Enter command: execute
Attempting to execute last freed address 0x600001bf4030
You found the flag!
Enter command:
NOTHING IN LIFE IS FREE
As the GNU License has taught us, nothing worth anything in life is truly free. Seems there is always a catch. Same with free’ing memory in libmalloc. Freeing the same block of memory twice results in in terrible things. This is called a double free. Libmalloc has a check to prevent this class of vulnerability from being exploited by aborting the process.
./heapster 4 4
Allocated at 0x600003a40050 Zone: Nano
Allocated at 0x600003a40060 Zone: Nano
Allocated at 0x600003a40070 Zone: Nano
Allocated at 0x600003a40080 Zone: Nano
Enter command: free 0x600003a40080
Freed 0x600003a40080
Enter command: free 0x600003a40080
heapster(64668,0x2090a0140) malloc: *** error for object 0x600003a40080: pointer being freed was not allocated
heapster(64668,0x2090a0140) malloc: *** set a breakpoint in malloc_error_break to debug
[1]    64668 abort      ./heapster 4 4
But how does libmalloc know if a memory block has been freed? You ask the best questions!
First, I’ll investigate the Nano zone, and I’ll be using the dump command to view memory:
./heapster 10 10
Allocated at 0x60000140c030 Zone: Nano
Allocated at 0x60000140c040 Zone: Nano
Allocated at 0x60000140c050 Zone: Nano
Allocated at 0x60000140c060 Zone: Nano
Allocated at 0x60000140c070 Zone: Nano
Allocated at 0x60000140c080 Zone: Nano
Allocated at 0x60000140c090 Zone: Nano
Allocated at 0x60000140c0a0 Zone: Nano
Allocated at 0x60000140c0b0 Zone: Nano
Allocated at 0x60000140c0c0 Zone: Nano
Enter command: free 0x60000140c0c0
Freed 0x60000140c0c0
Enter command: dump 0x60000140c0c0 32
Dumping memory at address 0x60000140c0c0:
0x60000140C0C0 C0 C0 85 91 64 11 00 00 FB 07 00 00 00 00 00 00  | ....d...........
0x60000140C0D0 00 00 00 00 00 00 00 00 00 00 00 00 00 00 00 00  | ................
Enter command:
Notice the least significant bytes match the target address. What happens if I overwrite this value and free it again? I use the cw , controlled write, to write to this address.
Enter command: cw 0x60000140C0C0 0x414141414141
Written 0x414141414141 to 0x60000140c0c0
Enter command: dump 0x60000140c0c0 16
Dumping memory at address 0x60000140c0c0:
0x60000140C0C0 41 41 41 41 41 41 00 00 FB 07 00 00 00 00 00 00  | AAAAAA..........
Enter command: free 0x60000140c0c0
Freed 0x60000140c0c0
Enter command: dump 0x60000140c0c0 16
Dumping memory at address 0x60000140c0c0:
0x60000140C0C0 C0 C0 85 91 64 11 00 00 0D 00 00 00 00 00 00 00  | ....d...........
Enter command:
Ok, so this value is clearly a marker for being freed.
Enter command: free 0x60000140c090
Freed 0x60000140c090
Enter command: free 0x60000140c0a0
Freed 0x60000140c0a0
Enter command: free 0x60000140c0b0
Freed 0x60000140c0b0
Enter command: dump 0x60000140c090 64
Dumping memory at address 0x60000140c090:
0x60000140C090 90 C0 85 91 64 11 00 00 0D 00 00 00 00 00 00 00  | ....d...........
0x60000140C0A0 A0 C0 85 91 64 11 00 00 0A 00 00 00 00 00 00 00  | ....d...........
0x60000140C0B0 B0 C0 85 91 64 11 00 00 0B 00 00 00 00 00 00 00  | ....d...........
0x60000140C0C0 C0 C0 85 91 64 11 00 00 0D 00 00 00 00 00 00 00  | ....d...........
Let’s find in code what causes this behavior. Located in libmalloc/src/nano2_malloc, there is a mechanism that sets the memory to a cookie that with that uses the randomized value to mask the more significant bits of the address, leaving the last two bytes unmasks.
3152          // Initialize the cookies used to detect double freeing and for the ASLR
3153	        // scramble mapping.
3154 #define COOKIE_ENTROPY_MASK             0x0000ffffffff0000ULL
3155 #define DEFAULT_ENTROPY_BITS    0x0000DEADDEAD0000ULL
3156         uintptr_t cookie = (uintptr_t)malloc_entropy[0] & COOKIE_ENTROPY_MASK;
3157         if (!cookie) {
3158                 cookie = malloc_entropy[1] & COOKIE_ENTROPY_MASK;
3159                 if (!cookie) {
3160                         // The cookie can't be zero, because it's used to compute the guard
3161                         // value in free slots, so make sure we have a non-zero value. Using
3162                         // a fixed value allows us to recognize that it isn't real entropy.
3163                         cookie = DEFAULT_ENTROPY_BITS;
3164                 }
3165         }
3166         nanozone->slot_freelist_cookie = cookie;
3167
3168         // For the ASLR cookie, we take the top 12 bits of malloc_entropy[1] and
3169         // align it to the block field of a Nano address.
3170         nanozone->aslr_cookie = malloc_entropy[1] >> (64 - NANOV2_BLOCK_BITS);
3171         nanozone->aslr_cookie_aligned = nanozone->aslr_cookie << NANOV2_OFFSET_BITS;
3172
The mask does not equal the ASLR side for the process. However, if you can view freed memory and you know the address of what was freed, calculating the mask is simple subtraction. Here’s an example of finding the cookie mask.
./heapster 10 5
Allocated at 0x600001f10030 Zone: Nano
Allocated at 0x600001f10040 Zone: Nano
Allocated at 0x600001f10050 Zone: Nano
Allocated at 0x600001f10060 Zone: Nano
Allocated at 0x600001f10070 Zone: Nano
Enter command: free 0x600001f10070
Freed 0x600001f10070
Enter command: dump 0x600001f10070 16
Dumping memory at address 0x600001f10070:
0x600001F10070 70 00 FF DB 40 D3 00 00 FB 07 00 00 00 00 00 00  | p...@...........
The cookie is 0xD340DBFF0070. Subtract the holding address of 0x600001f10070 and you get a mask of 0x7340DA0E0000. What happens if you have a controlled write and you know the mask? You can crash the application.
Enter command: cw 0x600001f10030 0xD340DBFF0030
Written 0xd340dbff0030 to 0x600001f10030
Enter command: free 0x600001f10030
heapster(54674,0x1ea2ba080) malloc: *** error for object 0x600001f10030: pointer being freed was not allocated
heapster(54674,0x1ea2ba080) malloc: *** set a breakpoint in malloc_error_break to debug
[1]    54674 abort      ./heapster 10 5
In reality, this is a moot point as crashing an application is not the “hard part”. But at least almost everyone knows about nano cookies now.

What about for Tiny+ allocators, how is freed memory tracked? Are cookies used?
./heapster 1000 1
Allocated at 0x15b704080 Zone: Tiny
Enter command: free 0x15b704080
Freed 0x15b704080
Enter command: dump 0x15b704080 16
Dumping memory at address 0x15b704080:
0x15B704080 00 00 00 00 00 00 00 00 00 00 00 00 00 00 00 00  | ................
Enter command:
Looks like no cookie is used. So there must be a freed list of sorts. How is this tracked and is it really enforced all the time? Well, I found a particular bug where double free doesn’t apply to all allocated addresses for the Tiny zone allocator. This doesn’t happen all the time. I haven’t been able to replicate this in the Small or Medium zones.
./heapster 1000 2
Allocated at 0x15b704480 Zone: Tiny
Allocated at 0x15b704870 Zone: Tiny
Enter command: free 0x15b704480
Freed 0x15b704480
Enter command: free 0x15b704480
Freed 0x15b704480
Enter command: free 0x15b704480
heapster(55239,0x1ea2ba080) malloc: Double free of object 0x15b704480
heapster(55239,0x1ea2ba080) malloc: *** set a breakpoint in malloc_error_break to debug
[1]    55239 abort      ./heapster 1000 2
./heapster 1000 2
Allocated at 0x13ee04690 Zone: Tiny
Allocated at 0x13ee04a80 Zone: Tiny
Enter command: free 0x13ee04690
Freed 0x13ee04690
Enter command: free 0x13ee04690
Freed 0x13ee04690
Enter command: free 0x13ee04690
heapster(55259,0x1ea2ba080) malloc: Double free of object 0x13ee04690
heapster(55259,0x1ea2ba080) malloc: *** set a breakpoint in malloc_error_break to debug
[1]    55259 abort      ./heapster 1000 2
./heapster 1000 5
Allocated at 0x133f04080 Zone: Tiny
Allocated at 0x133f04470 Zone: Tiny
Allocated at 0x133f04860 Zone: Tiny
Allocated at 0x133f04c50 Zone: Tiny
Allocated at 0x133f05040 Zone: Tiny
Enter command: free 0x133f04080
Freed 0x133f04080
Enter command: free 0x133f04080
heapster(56020,0x1ea2ba080) malloc: Double free of object 0x133f04080
heapster(56020,0x1ea2ba080) malloc: *** set a breakpoint in malloc_error_break to debug
[1]    56020 abort      ./heapster 1000 5
./heapster 1000 5
Allocated at 0x13be04690 Zone: Tiny
Allocated at 0x13be04a80 Zone: Tiny
Allocated at 0x13be04e70 Zone: Tiny
Allocated at 0x13be05260 Zone: Tiny
Allocated at 0x13be05650 Zone: Tiny
Enter command: free 0x13be04690
Freed 0x13be04690
Enter command: free 0x13be04690
Freed 0x13be04690
Enter command: free 0x13be04a80
Freed 0x13be04a80
Enter command: free 0x13be04a80
Freed 0x13be04a80
Enter command: free 0x13be04e70
Freed 0x13be04e70
Enter command: free 0x13be04e70
Freed 0x13be04e70
Enter command: free 0x13be05260
Freed 0x13be05260
Enter command: free 0x13be05260
Freed 0x13be05260
Enter command: free 0x13be05650
Freed 0x13be05650
Enter command: free 0x13be05650
Freed 0x13be05650
Enter command: free 0x13be05650
heapster(56052,0x1ea2ba080) malloc: Double free of object 0x13be05650
heapster(56052,0x1ea2ba080) malloc: *** set a breakpoint in malloc_error_break to debug
Well, what allows for the random double free to bypass this mitigation? Does this affect Small, Medium, and Large zones also?
# TINY
./heapster 1000 2
Allocated at 0x14d604690 Zone: Tiny
Allocated at 0x14d604a80 Zone: Tiny
Enter command: free 0x14d604690
Freed 0x14d604690
Enter command: free 0x14d604690
Freed 0x14d604690
Enter command: free 0x14d604690
heapster(60119,0x1ea2ba080) malloc: Double free of object 0x14d604690
heapster(60119,0x1ea2ba080) malloc: *** set a breakpoint in malloc_error_break to debug
[1]    60119 abort      ./heapster 1000 2
# SMALL
./heapster 1009 2
Allocated at 0x143808200 Zone: Small
Allocated at 0x143809600 Zone: Small
Enter command: free 0x143808200
Freed 0x143808200
Enter command: free 0x143808200
heapster(59459,0x1ea2ba080) malloc: double free for ptr 0x143808200
heapster(59459,0x1ea2ba080) malloc: *** set a breakpoint in malloc_error_break to debug
[1]    59459 abort      ./heapster 1009 2
# MEDIUM
./heapster 33000 2
Allocated at 0x158008000 Zone: Medium
Allocated at 0x158018000 Zone: Medium
Enter command: free 0x158008000
Freed 0x158008000
Enter command: free 0x158008000
heapster(59545,0x1ea2ba080) malloc: double free for ptr 0x158008000
heapster(59545,0x1ea2ba080) malloc: *** set a breakpoint in malloc_error_break to debug
[1]    59545 abort      ./heapster 33000 2
# LARGE
./heapster 10000000 2
Allocated at 0x13b800000 Zone: Large
Allocated at 0x13c18c000 Zone: Large
Enter command: free 0x13b800000
Freed 0x13b800000
Enter command: free 0x13b800000
heapster(60084,0x1ea2ba080) malloc: *** error for object 0x13b800000: pointer being freed was not allocated
heapster(60084,0x1ea2ba080) malloc: *** set a breakpoint in malloc_error_break to debug
[1]    60084 abort      ./heapster 10000000 2
Notice the difference in errors. Small and Medium have the same errors, Tiny and Large each have their own.
For Large, the error message originates from ./src/malloc.c. And since Large is not in Nano, Tiny, Small, or Medium zones, the free’d memory check resolves here.
2449         if (!zone) {
2450                 int flags = MALLOC_REPORT_DEBUG | MALLOC_REPORT_NOLOG;
2451                 if ((malloc_debug_flags & (MALLOC_ABORT_ON_CORRUPTION | MALLOC_ABORT_ON_ERROR))) {
2452                         flags = MALLOC_REPORT_CRASH | MALLOC_REPORT_NOLOG;
2453                 }
2454                 malloc_report(flags,
2455                                 "*** error for object %p: pointer being freed was not allocated\n",      ptr);
Both Small and Medium have the same double free error message and each is handled in their own magazine file.
grep -rn 'double free for ptr' ./
.//src/magazine_small.c:2201:	malloc_zone_error(rack->debug_flags, true, "double free for ptr %p\n", ptr);
.//src/magazine_medium.c:2523:	malloc_zone_error(rack->debug_flags, true, "double free for ptr %p\n", ptr);
Looking at source code you find their functions that check freed memory almost identical:
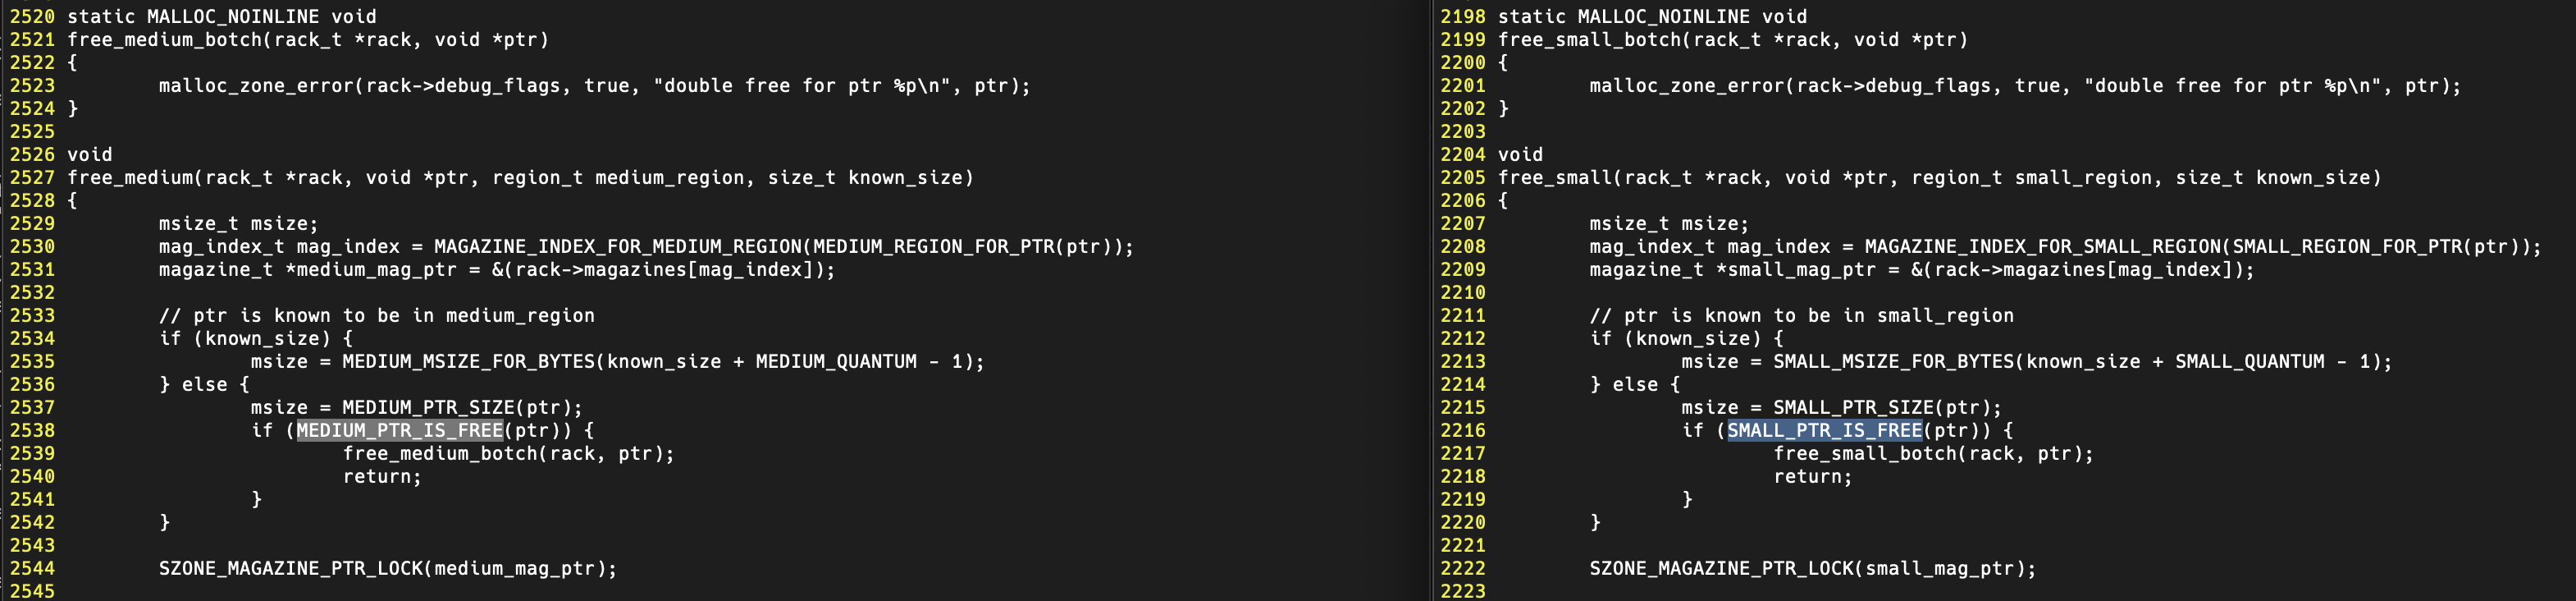
Each calls to either SMALL_PTR_IS_FREE or MEDIUM_PTR_IS_FREE and this leads to the header file ./src/magazine_zone.h where the following macros are defined for medium:
575 #define MEDIUM_IS_FREE (1 << 15)
[snip]
718  * Determine whether a pointer known to be within a medium region points to memory which is free.
719  */
720 #define MEDIUM_PTR_IS_FREE(ptr) (*MEDIUM_METADATA_FOR_PTR(ptr) & MEDIUM_IS_FREE)
And in ./src/magazine_medium.c you see how blocks are marked as free and not free. Small follows the same functionality, except for naming. For small and medium zones meta_headers[index] carries the setting for whether the memory is free or not.
97 /*
  98  * Mark a block as free.  Only the first quantum of a block is marked thusly,
  99  * the remainder are marked "middle".
 100  */
 101 static MALLOC_INLINE void
 102 medium_meta_header_set_is_free(msize_t *meta_headers, msize_t index, msize_t msize)
 103 {
 104         meta_headers[index] = msize | MEDIUM_IS_FREE;
 105 }
 106
 107 /*
 108  * Mark a block as not free, preserving its size.
 109  */
 110 static MALLOC_INLINE void
 111 medium_meta_header_set_not_free(msize_t *meta_headers, msize_t index)
 112 {
 113         meta_headers[index] &= ~MEDIUM_IS_FREE;
 114 }
Thusly indeed.
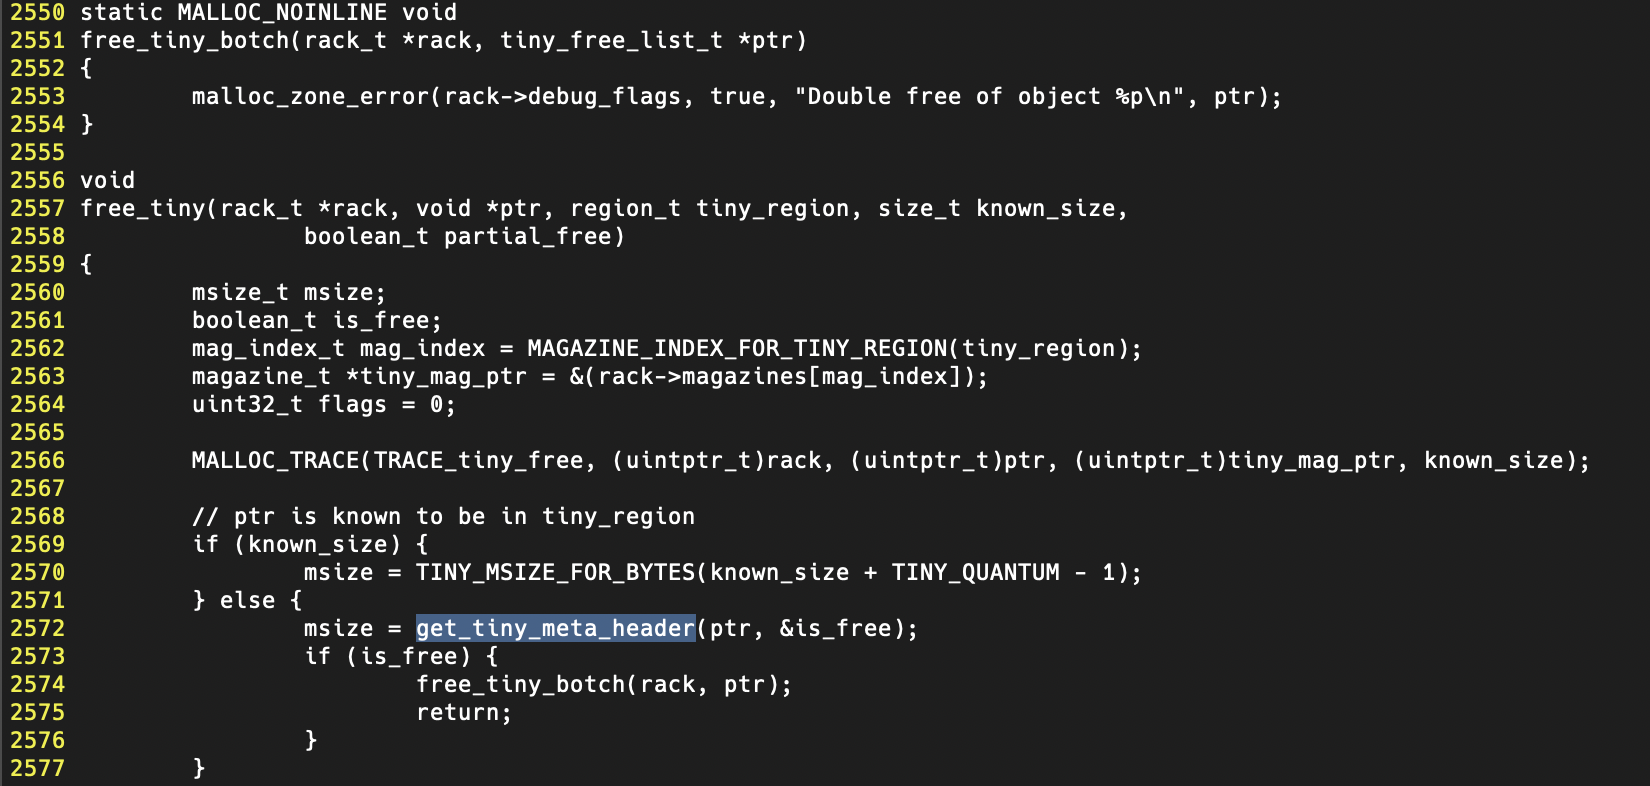
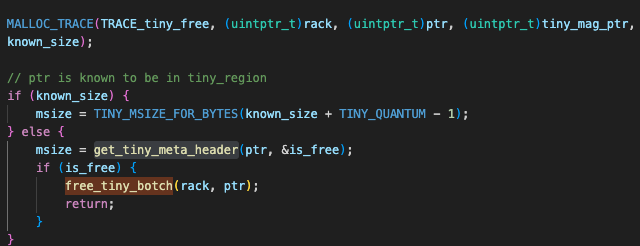
Now for tracking down the “sometimes double free” in the Tiny zone. Looking in ./src/magazine_tiny.c you can see that the function get_tiny_meta_header takes ptr and a boolean variable (is_free). If is_free is 1 (true), then you have a double free.
This function is interesting for a number of reasons. At first, I felt like the disassembly in LLDB did not line up with the public source code in c, and I felt like it was more than compiler optimizations and macro expansion. So, I need the libmalloc dylib to verify version and perform some reverse engineering of these functions outside of a debugger. Next, I used dyld-shared-cache-extractor to extract the libmalloc dylib from the dyld shared cache.
./dyld-shared-cache-extractor \
/System/Volumes/Preboot/Cryptexes/Incoming/OS/System/Library/dyld/dyld_shared_cache_arm64e \
output
Using otool you can get the version information from the dylib and this matches the latest version of source code.
otool -L .//output/usr/lib/system/libsystem_malloc.dylib
.//output/usr/lib/system/libsystem_malloc.dylib:
	/usr/lib/system/libsystem_malloc.dylib (compatibility version 1.0.0, current version 474.0.13)
Now I can disassemble this dylib in Binary Ninja and explore paths as I debug the issue.
After looking at this function in Binary Ninja High Level IL and comparing source, you can see that the compiled code is a result of compiler optimization. 😅
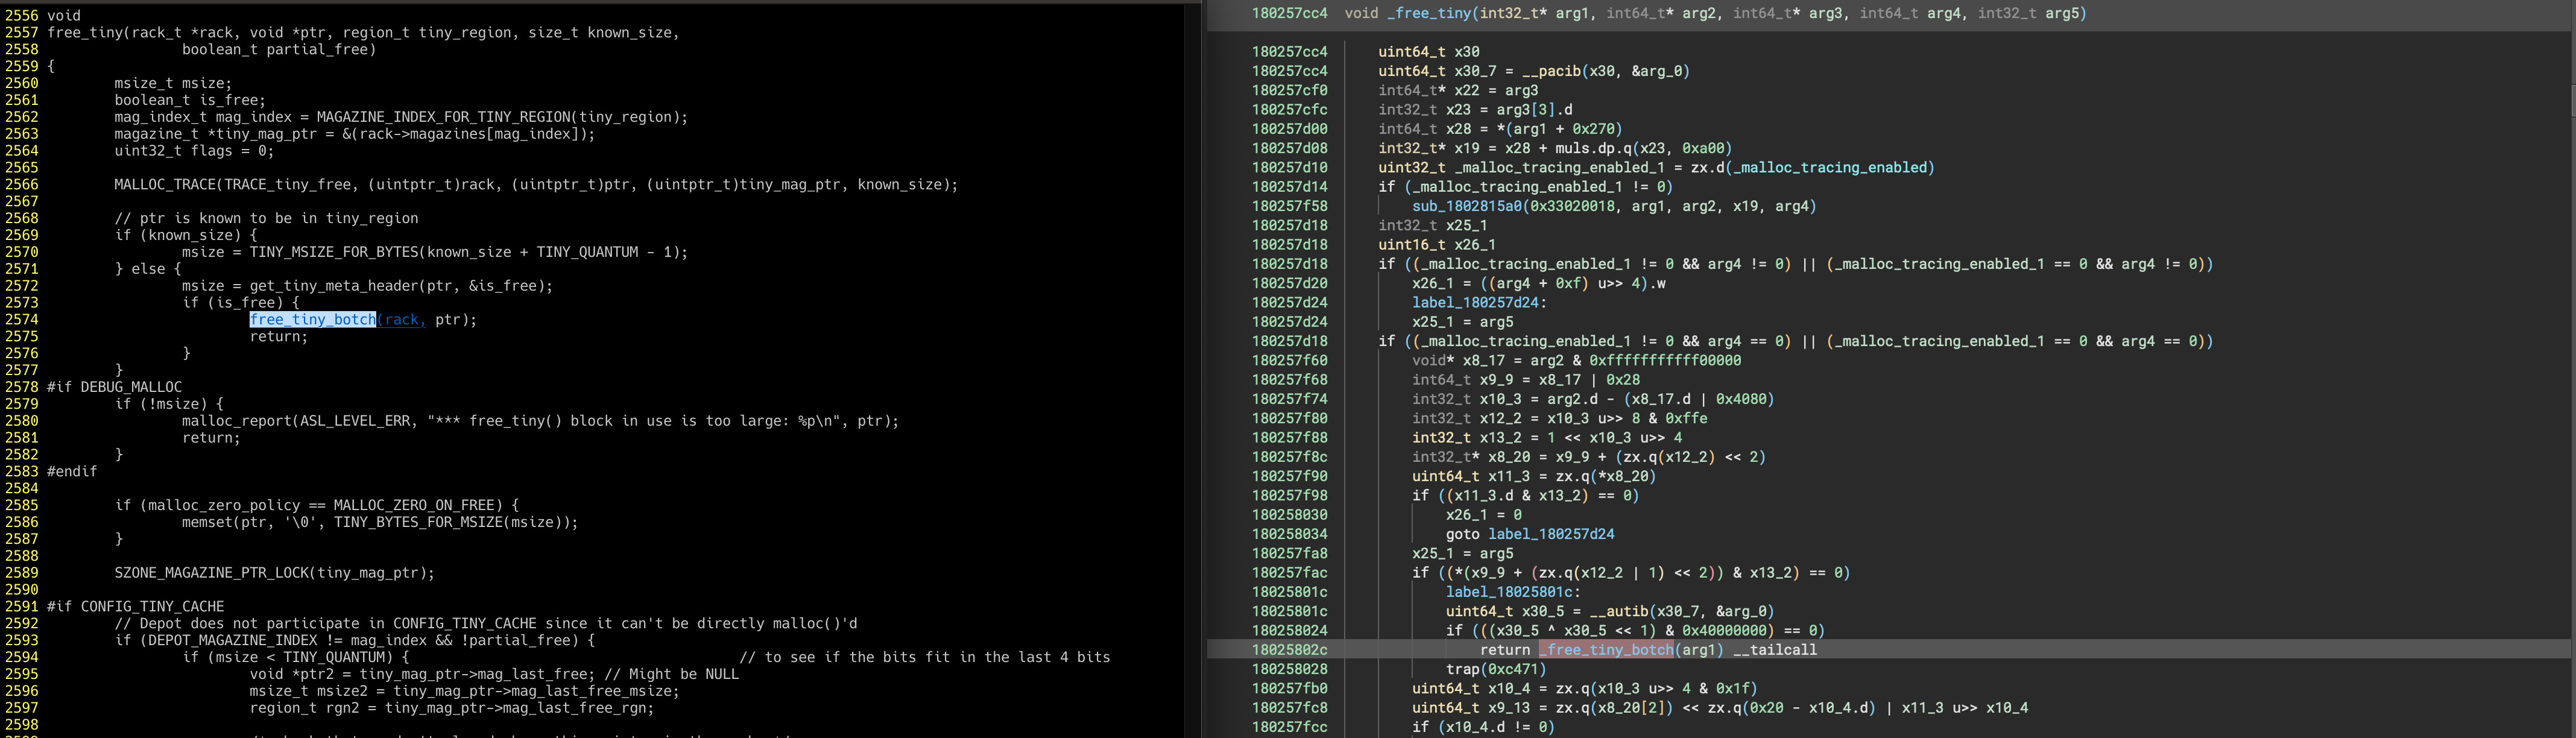
After using LLDB and Binja in concert, I appears the bug lives in the Malloc_Trace functionality.
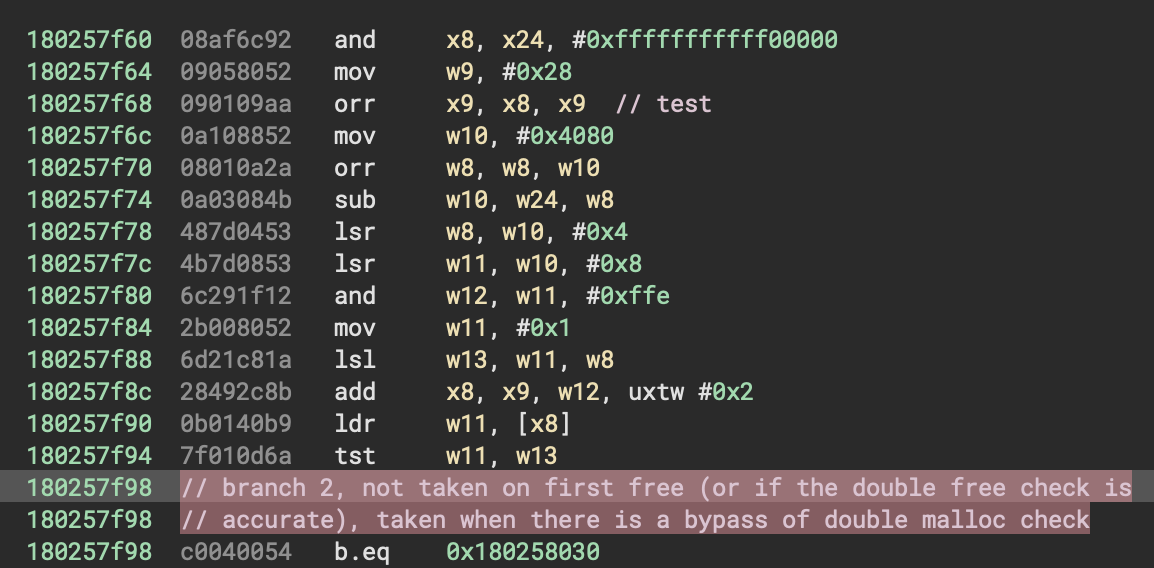
I verified this by enabling malloc tracing, e.g. MallocTracing=1 ./heapster 1000 10, the bug was no longer being executed and the double free check works normally. I don’t consider this potential bypass of a mitigation a vulnerability in itself - just interesting information.
QUANTUM BEHAVIOR
As you might have guessed, quantum in libmalloc does not mean the same as quantum computers (or as I like to call them kelvin computers). However, you can attempt to free quantums in libmalloc. You might have noticed in the last section that Tiny, Small, and Medium allocators check to see if a pointer is in a zone before freeing. Any pointer? Yeah. Quantums align in predictable spaces within allocated memory, they have pointers. Let me show you:
./heapster 1000 5
Allocated at 0x134604800 Zone: Tiny
Allocated at 0x134604bf0 Zone: Tiny
Allocated at 0x134604fe0 Zone: Tiny
Allocated at 0x1346053d0 Zone: Tiny
Allocated at 0x1346057c0 Zone: Tiny
Enter command: free 0x134604810
Freed 0x134604810
Enter command: free 0x134604820
Freed 0x134604820
Enter command: free 0x134604831
heapster(4725,0x1e1b2d000) malloc: *** error for object 0x134604831: pointer being freed was not allocated
heapster(4725,0x1e1b2d000) malloc: *** set a breakpoint in malloc_error_break to debug
[1]    4725 abort      ./heapster 1000 5
In this example, I’m freeing each consecutive quantum in the allocated block for 0x134604800, if I try to free an address that’s not on the quantum alignment, I get a handy error telling me it’s not a pointer.
But does it actually free anything?
Not exactly. Here’s an example of writing to a section of memory and freeing it at the quantum:
./heapster 1000 5
Allocated at 0x123604800 Zone: Tiny
Allocated at 0x123604bf0 Zone: Tiny
Allocated at 0x123604fe0 Zone: Tiny
Allocated at 0x1236053d0 Zone: Tiny
Allocated at 0x1236057c0 Zone: Tiny
Enter command: cw 0x123604810 0x414141414141
Written 0x414141414141 to 0x123604810
Enter command: dump 0x123604800 32
Dumping memory at address 0x123604800:
0x123604800 00 00 00 00 00 00 00 00 00 00 00 00 00 00 00 00  | ................
0x123604810 41 41 41 41 41 41 00 00 00 00 00 00 00 00 00 00  | AAAAAA..........
Enter command: free 0x123604810
Freed 0x123604810
Enter command: dump 0x123604800 32
Dumping memory at address 0x123604800:
0x123604800 00 00 00 00 00 00 00 00 00 00 00 00 00 00 00 00  | ................
0x123604810 41 41 41 41 41 41 00 00 00 00 00 00 00 00 00 00  | AAAAAA..........
Enter command:
The data is still there as it’s not a pointer to the allocated memory. But yet, it’s still tracked because if you try to free it multiple times you’ll hit the double free guard. In The Small zone, if you free a quantum and then free the pointer to the block you get trace trap.
./heapster 2000 5
Allocated at 0x129008800 Zone: Small
Allocated at 0x12900a000 Zone: Small
Allocated at 0x12900a800 Zone: Small
Allocated at 0x12900b000 Zone: Small
Allocated at 0x12900b800 Zone: Small
Enter command: free 0x129008a00
Freed 0x129008a00
Enter command: free 0x129008800
[1]    5061 trace trap  ./heapster 2000 5
The associated backtrace:
Process 5061 stopped
* thread #1, queue = 'com.apple.main-thread', stop reason = EXC_BREAKPOINT (code=1, subcode=0x18b19043c)
    frame #0: 0x000000018b19043c libsystem_malloc.dylib`small_free_list_add_ptr.cold.1
Target 0: (heapster) stopped.
(lldbinit) bt
* thread #1, queue = 'com.apple.main-thread', stop reason = EXC_BREAKPOINT (code=1, subcode=0x18b19043c)
  * frame #0: 0x000000018b19043c libsystem_malloc.dylib`small_free_list_add_ptr.cold.1
    frame #1: 0x000000018b168f28 libsystem_malloc.dylib`small_free_list_add_ptr + 524
    frame #2: 0x000000018b166e60 libsystem_malloc.dylib`free_small + 876
    frame #3: 0x000000010223ee4c heapster`main + 1104
    frame #4: 0x000000018afcd0e0 dyld`start + 2360
In the Medium zone, here’s an example to show that’s it not affected by this.
./heapster 33000 5
Allocated at 0x128008000 Zone: Medium
Allocated at 0x128018000 Zone: Medium
Allocated at 0x128028000 Zone: Medium
Allocated at 0x128038000 Zone: Medium
Allocated at 0x128048000 Zone: Medium
Enter command: cw 0x128009000 0x414141414141
Written 0x414141414141 to 0x128009000
Enter command: free 0x128009000
Freed 0x128009000
Enter command: dump 0x128009000 16
Dumping memory at address 0x128009000:
0x128009000 41 41 41 41 41 41 00 00 00 00 00 00 00 00 00 00  | AAAAAA..........
Enter command: free 0x128008000
Freed 0x128008000
Enter command: free 0x128008000
heapster(5125,0x1e1b2d000) malloc: double free for ptr 0x128008000
heapster(5125,0x1e1b2d000) malloc: *** set a breakpoint in malloc_error_break to debug
[1]    5125 abort      ./heapster 33000 5
So what does this mean? I’m not sure, but I’m sure with this information you’ll impress your friends. Maybe it affects metadata for that magazine. Either way, I’ll need to update the earlier mentioned debugging tools to dig into this further.
CONCLUSION
Well I hope you enjoyed this short post on libmalloc. This blog post covered some of the new things in the macOS libmalloc implementation and presented a tool called heapster to help people interact with libmalloc and maybe learn something about it. What will you find? Feedback is welcome! If there are any bugs, features, or additional techniques you would like to see fixed or implemented in heapster, please reach out to me on twitter/x or github.